Tim Ottinger and Jeff Langr
Font: Brown Bag Lunch
In keeping with the agile value of Communication, agile teams often place large charts and graphs in their workspaces to radiate important information such as defect rates, rate of completion, and measures of code goodness (CRC, bugs, test counts). Much is made of Informative Workspaces or Big Visible Charts (BVCs).
You'll find numerous graph types in the agile literature. Some types, such as burn-up, burn-down, and cumulative flow are commonly used to graph progress against a goal such as an epic story. Defects and velocity are also useful things to track, but don't limit yourself. Let your team determine--and let these information radiator principles guide--what you track and publicize.
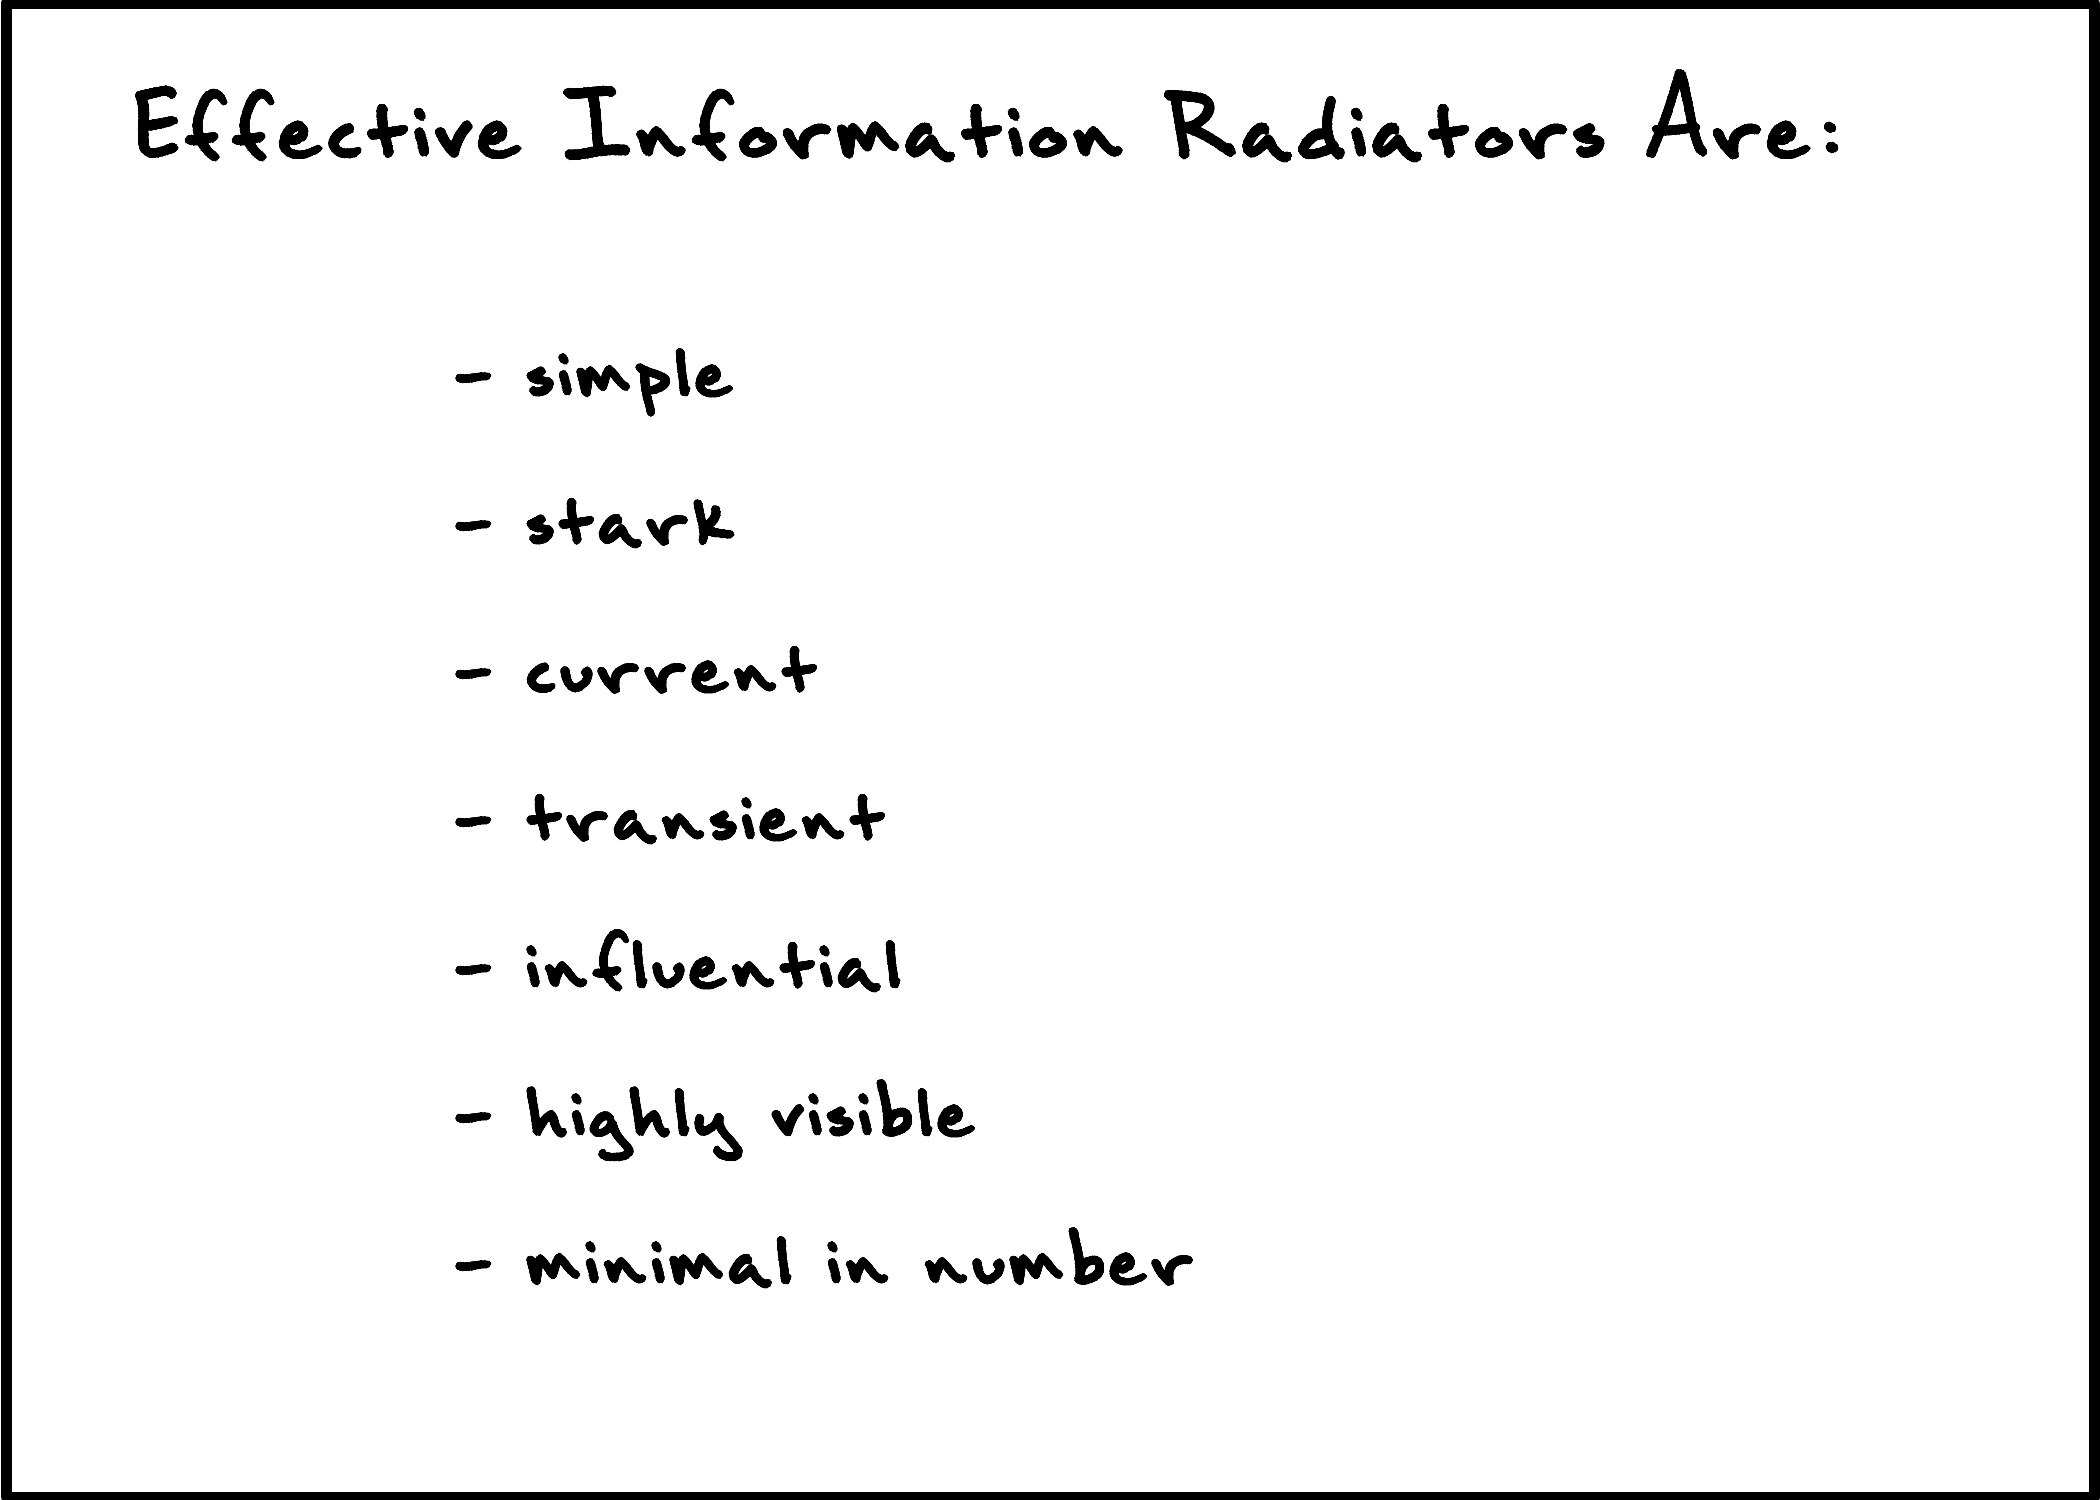
- Simple
A chart or graph should not require minutes or hours of study. Ensure it is brief and concise. Anything dense or complicated will fail to communicate. Also, don't use highly derivative, biased, weighted information. Simple facts speak more profoundly than clever algorithms. - Stark
BVCs don't exist to convince the public of your team's excellence. Nor should you mask errors or problems with them. The purpose of the graphs is to display progress and expose problems. Don't subvert the honesty of the graphs, otherwise your team will stop trusting them, and therefore stop using them to improve their work.
- Current
Any information that is not kept current is quickly ignored. You may want to have the CI build graphs based on automatically-generated stats. Information more than a few days old is too stale to have evocative powers. - Transient
Radiators that only expose problems shouldn't be up there long, otherwise it's clear that you aren't solving your problems. Choose a BVC to highlight a current challenge for which you can demonstrably show improvement over the next several days or iterations. Once it's clear the team has gotten the message, and things are back on track, take down the BVC.
- Influential
A good information radiator influences the team's daily work. It may also influence managers, customers, developers, or other stakeholders. Ideally it will empower the whole team to make better decisions, otherwise it is not worth preparing and presenting. - Highly visible
An effective information radiator needs to not only have information on it, but must transfer it to team members, stakeholders, and passers-by. - Minimal in number
Having too many graphs or charts will cause all of the charts to lose evocative power. Also, exposing too many problems on the wall at one time can demoralize any team, so choose either the most important, timely, or fixable problem to highlight, and defer the rest. Sometimes less truly is more.
I'm wondering if it's worth trying to create a mnemonic for this list
ReplyDeleteAs an aside, are these going to be like IDEO Method Cards with a picture on the other side or just the text?
ReplyDeleteHi Jason--
ReplyDeleteThe front will remain the list; the back will be text, a little less expository and a bunch more concisely meaty.
As far as a mnemonic, good idea. C-SMITHS a starting point? Makes me think of card-smiths, communication-smiths?
SCHMITS?
ReplyDeleteSCM SHIT? Well, it'd be great if we were doing somethng on CI... How about, these are the MC-SHITS of Agile McSuccess?
ReplyDelete